Create better charts, maps, and tables with ease.
The new standard in data visualization: Datawrapper lets you create high-quality visualizations in a single powerful web app.
You can try it, no account needed
And publish your visualizations wherever you want.
Design once, use everywhere. Lorem ipsum dolor sit amet consectetur. Nibh volutpat egestas posuere nisi blandit scelerisque porttitor.
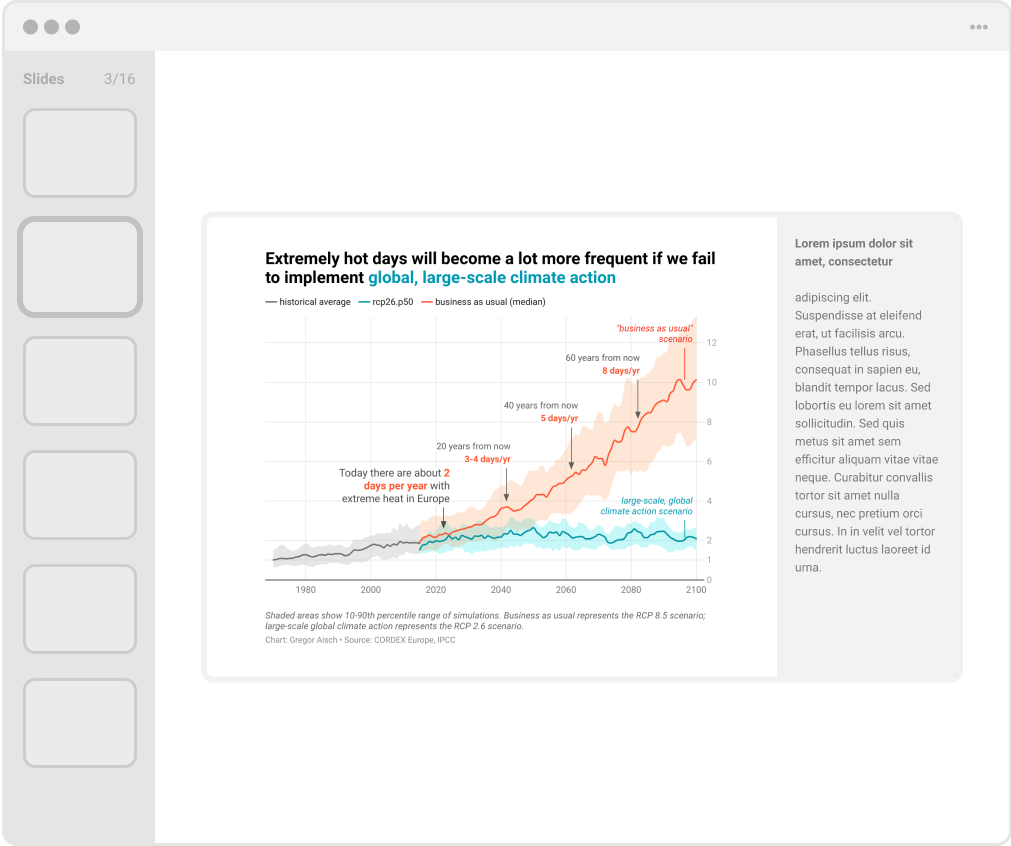
Mobile
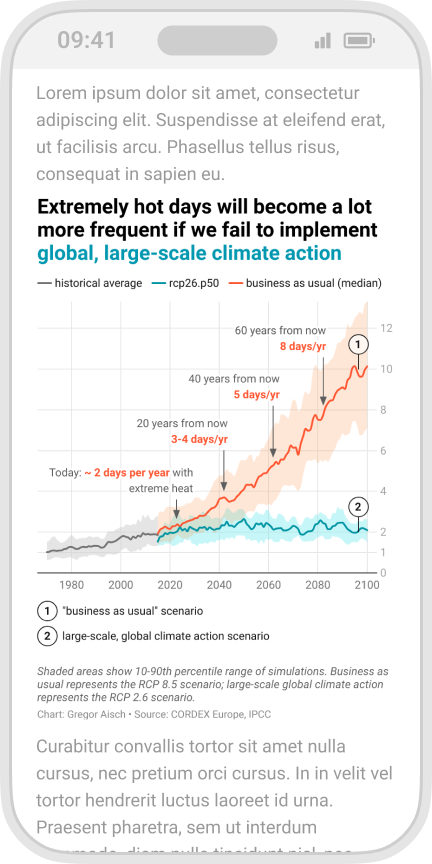
Web
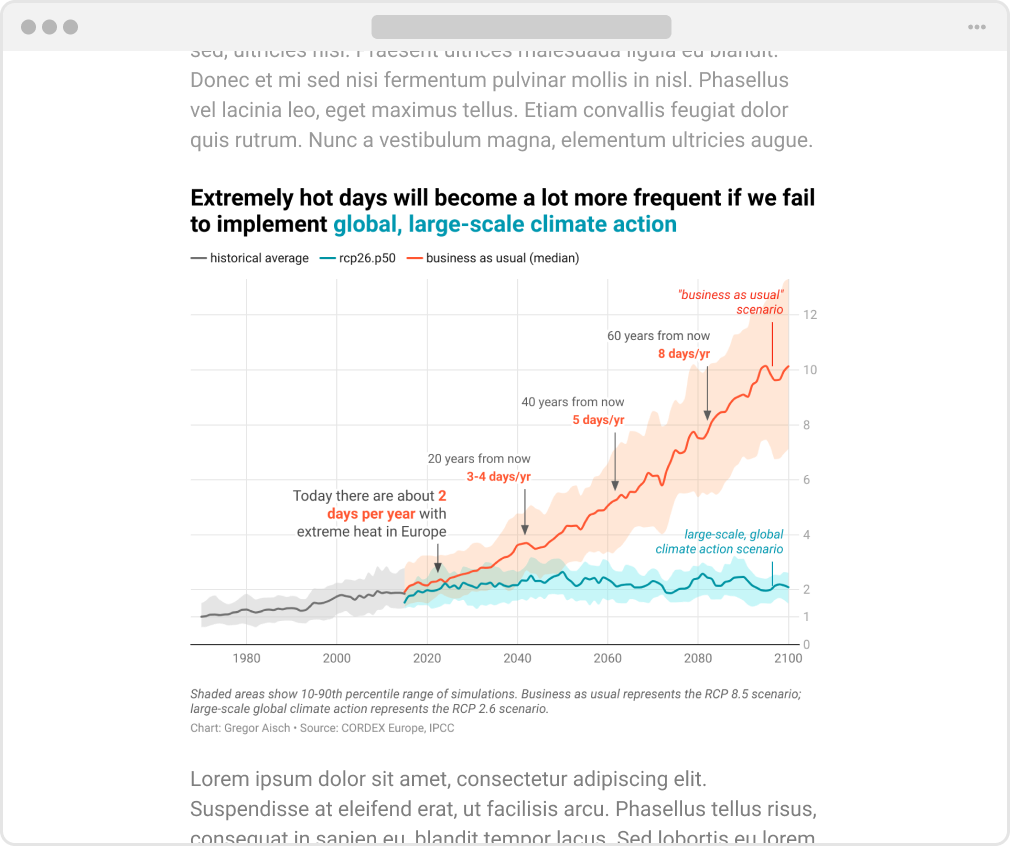
PowerPoint
Make sure your charts, maps and tables
always look their best.
Datawrapper makes it easy for you to design good visualizations.
Every visualization you create will be:
Every visualization you create will be:


Professional and beautiful down to the last detail
We've carefully optimized the layout and typography of each chart type. You won't need a design degree to create great looking charts, maps and tables.
Readable and accessible by default and by principle
Labels that don't overlap. Annotations that get out of the way. Colors that are accessible by default—to name just a few of the features.
And fit your brand perfectly.
Custom Theme
Header
Headline
Description
Chart
Swatch
Label
Label
Footer
Source
Embed